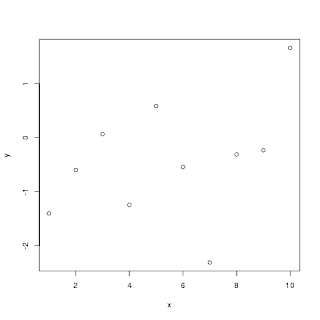
# 数値ベクトル同士のplot
x <- c(1:10) # 1から10までの整数ベクトルを生成する
y <- rnorm(10) # rnorm(n): 正規分布に従う乱数をn個生成する
cat("x = ", x, "\n")
cat("y = ", y, "\n")
# x, yのplot
png('test0-plot.png')
plot(x, y)
dev.off()
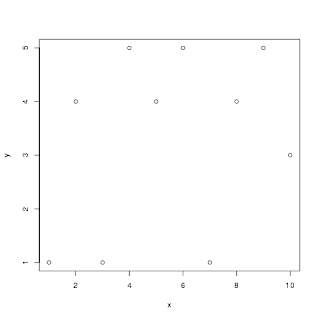
# y=整数のplot
y <- runif(10, min = 1, max=6) # runif(n, min, max): minからmaxの範囲でn個の乱数を生成する
y <- as.integer(y) # 小数点以下を切り捨て
cat("x = ", x, "\n")
cat("y = ", y, "\n")
png('test0-plot1.png')
plot(x, y)
dev.off()
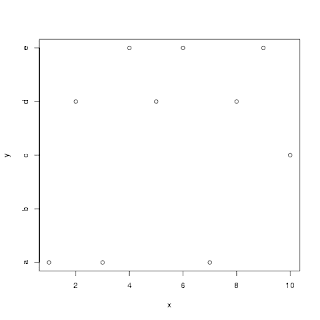
# Y軸の項目を置き換える
png('test0-plot2.png')
plot(x, y, axes=F)
ylabels = c("a", "b", "c", "d", "e")
axis(2, 1:length(ylabels), labels=ylabels)
axis(1, labels=T)
box()
dev.off()
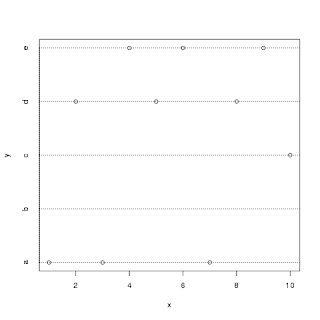
# 参照線を引く
png('test0-plot3.png')
plot(x, y, axes=F)
axis(2, 1:length(ylabels), labels=ylabels, tck=1.0, lty="dotted")
axis(1, labels=T)
box()
dev.off()
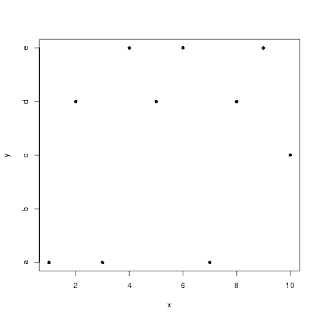
# プロットのマーカーを変更する(pch=16は黒丸)
png('test0-plot4.png')
plot(x, y, axes=F, pch=16)
axis(2, 1:length(ylabels), labels=ylabels)
axis(1, labels=T)
box()
dev.off()
実行結果
$ Rscript test0.R
x = 1 2 3 4 5 6 7 8 9 10
y = -1.404267 -0.5969088 0.06568647 -1.244883 0.5858204 -0.5415655 -2.311732 -0.3103803 -0.2324204 1.663108
null device
  1
x = 1 2 3 4 5 6 7 8 9 10
y = 1 4 1 5 4 5 1 4 5 3
null device
  1
null device
  1
null device
  1
null device
  1
test0-plot.png
test0-plot1.png
test0-plot2.png
test0-plot3.png
test0-plot4.png