# -*- coding:utf-8 -*-
from numpy import *
import Gnuplot, Gnuplot.funcutils
import os
import time

# temporary ディレクトリを current directory にする
os.environ['TEMP']="."

# debug=1 を引数に付けるとコンソールに gnuplot に渡したコマンドが表示される
g = Gnuplot.Gnuplot(debug=1)
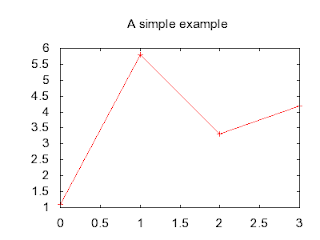
g.title('A simple example')

# PNG ファイルに出力する場合は以下の 2 行を追加する
g('set term png size 400,300')
g("set output 'sample00.png'")

# Gnuplot に指示を与える
g('set data style linespoints') # give gnuplot an arbitrary command

# Plot
g.plot([[0,1.1], [1,5.8], [2,3.3], [3,4.2]])

# こちらでも png 出力可能, 一瞬 window が表示される
#g.hardcopy('sample00.png', terminal = 'png')
# Window 表示の場合は下記を有効にしてスクリプトを止める
#raw_input('Please press return to continue...\n')
# すぐに終了してしまうとデータ出力できないので 1sec sleep
time.sleep(1)


0 件のコメント:
コメントを投稿