2017年10月21日土曜日

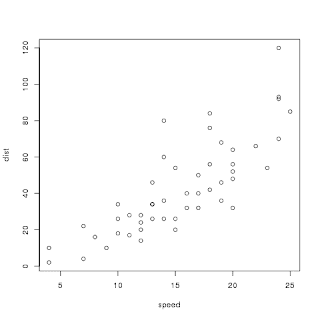
[R]2変量の散布図

# 2変量の散布図
png('test3.png')
plot(cars)
dev.off()

# 相関係数Rを求める
r = cor(cars$speed, cars$dist)
r

# 相関かどうかの検定
cor.test(cars$speed, cars$dist)
実行結果
$ Rscript test3.R
null device
  1
[1] 0.8068949

  Pearson's product-moment correlation

data: cars$speed and cars$dist
t = 9.464, df = 48, p-value = 1.49e-12
alternative hypothesis: true correlation is not equal to 0
95 percent confidence interval:
 0.6816422 0.8862036
sample estimates:
  cor
0.8068949
Pearson's product-moment correlationの内容
ParameterDescription
dfDegrees of Freedom
p-valuep値
95 percent confidence interval95%信頼区間
出力結果

[R]単回帰分析

# 2変量の散布図
png('test1-0.png')
plot(cars)
dev.off()

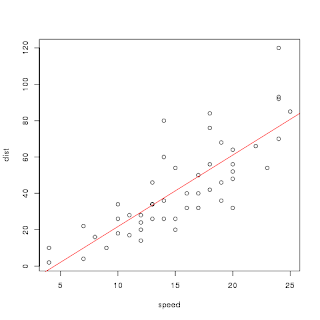
# 単回帰分析(simple linear regression analysis)を行う
# lm: linear model
result <- lm(dist ~ speed, data=cars)
summary(result)

# 結果の直線を描画する
# abline(a, b): 切片a, 傾きb(y=a+bx)の直線を描く
# abline(result): resultにlm()の結果が入っている場合は回帰直線を描く
png('test1-1.png')
plot(cars)
abline(result, col="red")
dev.off()
実行結果
$ Rscript test1.R
null device
  1

Call:
lm(formula = dist ~ speed, data = cars)

Residuals:
  Min 1Q Median 3Q Max
-29.069 -9.525 -2.272 9.215 43.201

Coefficients:
  Estimate Std. Error t value Pr(>|t|)
(Intercept) -17.5791 6.7584 -2.601 0.0123 *
speed 3.9324 0.4155 9.464 1.49e-12 ***
---
Signif. codes: 0 ‘***’ 0.001 ‘**’ 0.01 ‘*’ 0.05 ‘.’ 0.1 ‘ ’ 1

Residual standard error: 15.38 on 48 degrees of freedom
Multiple R-squared: 0.6511, Adjusted R-squared: 0.6438
F-statistic: 89.57 on 1 and 48 DF, p-value: 1.49e-12

null device
  1
出力結果
test1-0.png

test1-1.png

[R]箱ひげ図

# 箱ひげ図を描く
x <- c(10, 20, 30, 40, 50, 30, 20)

png('test0.png')
boxplot(x)
dev.off()
出力結果

2017年9月6日水曜日

[Python][MongoDB]PyMongo:データの挿入

test4.py
#-*- coding: utf-8 -*-
import pymongo
import pytz

#######################################################################
# Main function
#######################################################################
if __name__ == '__main__':
# MongoDBに接続するためのclientを作成する
client = pymongo.MongoClient()

# Databaseに接続する
db = client.test

# Collectionを取得する
collection = db.tbl1

# insert()
data = {
'message': 'thank you',
'value' : 30
}
id = collection.insert(data)
print('id=%s' % (id))

print('\n')
print('find()')
documents = collection.find({'_id':id})
for doc in documents:
#print(doc)
print('%s\t%s\t%d' % (doc['_id'], doc['message'], doc['value']))
実行結果
$ python test4.py
id=59af9cdce138234fdf70d696

find()
59af9cdce138234fdf70d696 thank you 30

[Python][MongoDB]PyMongo

PyMongoはPythonからMongDBを使うためのAPI

インストール

# yum install python-pymongo

データの表示

#-*- coding: utf-8 -*-
import pymongo
import pytz

#######################################################################
# Main function
#######################################################################
if __name__ == '__main__':
# MongoDBに接続するためのclientを作成する
client = pymongo.MongoClient()

# Databaseに接続する
db = client.test

# Collectionを取得する
collection = db.tbl1

# find()
print('find()')
documents = collection.find()
for doc in documents:
#print(doc)
print('%s\t%d' % (doc['message'], doc['value']))

print('\n')
print("find({'message':'hello'})")
documents = collection.find({'message':'hello'})
print('count=%d' % (documents.count()))
for doc in documents:
#print(doc)
print('%s\t%d' % (doc['message'], doc['value']))

print('\n')
print("find({'value':{'$gte':10}})")
documents = collection.find({'value':{'$gte':10}})
print('count=%d' % (documents.count()))
for doc in documents:
#print(doc)
print('%s\t%d' % (doc['message'], doc['value']))
実行結果
$ python test3.py
find()
hello 10
goodbye 25

find({'message':'hello'})
count=1
hello 10

find({'value':{'$gte':10}})
count=2
hello 10
goodbye 25

[Python]jsonモジュール

test0.py
#-*- coding: utf-8 -*-
import json

#######################################################################
# Main function
#######################################################################
if __name__ == '__main__':
# jsonファイル(辞書型)の読み込み
print('=== read test0_dict_read.txt ===')
f = open('test0_dict_read.txt', 'r')
json_dict = json.load(f)
f.close()

print(json_dict)
print(json_dict['book1'])
print(json_dict['book1']["title"])
print(json.dumps(json_dict, indent=4))

# 辞書型をjsonファイルへ書き出し
print('=== write test0_dict_write.txt ===')
json_dict = {}
data = {}
data['name'] = 'tokyo'
data['temperature_high'] = 37.7
data['temperature_low'] = -2.6
json_dict["prefecture_1"] = data

print(json.dumps(json_dict, indent=4))

f = open('test0_dict_write.txt', 'w')
json.dump(json_dict, f)
f.close()

# jsonファイル(配列型)の読み込み
print('=== read test0_list_read.txt ===')
f = open('test0_list_read.txt', 'r')
json_list = json.load(f)
f.close()

print(json_list)
print(json_list[0])
print(json_list[0]['title'])
print(json.dumps(json_list, indent=4))

# 配列型をjsonファイルへ書き出し
print('=== write test0_list_write.txt ===')
json_list = []
data = {}
data['name'] = 'tokyo'
data['temperature_high'] = 37.7
data['temperature_low'] = -2.6
json_list.append(data)

data = {}
data['name'] = 'naha'
data['temperature_high'] = 33.9
data['temperature_low'] = 6.1
json_list.append(data)

print(json.dumps(json_list, indent=4))

f = open('test0_list_write.txt', 'w')
json.dump(json_list, f)
f.close()
test0_dict_read.txt
{
"book1":{
"title": "Python Beginners",
"year": 2005 ,
"page": 399
},
"book2":{
"title": "Python Developers",
"year": 2006 ,
"page": 650
}
}
test0_list_read.txt
[
{
"title": "Python Beginners",
"year": 2005 ,
"page": 399
},
{
"title": "Python Developers",
"year": 2006 ,
"page": 650
}
]
実行結果 コンソール
$ python test0.py
=== read test0_dict_read.txt ===
{u'book1': {u'year': 2005, u'page': 399, u'title': u'Python Beginners'}, u'book2': {u'year': 2006, u'page': 650, u'title': u'Python Developers'}}
{u'year': 2005, u'page': 399, u'title': u'Python Beginners'}
Python Beginners
{
  "book1": {
  "year": 2005,
  "page": 399,
  "title": "Python Beginners"
  },
  "book2": {
  "year": 2006,
  "page": 650,
  "title": "Python Developers"
  }
}
=== write test0_dict_write.txt ===
{
  "prefecture_1": {
  "temperature_high": 37.7,
  "temperature_low": -2.6,
  "name": "tokyo"
  }
}
=== read test0_list_read.txt ===
[{u'year': 2005, u'page': 399, u'title': u'Python Beginners'}, {u'year': 2006, u'page': 650, u'title': u'Python Developers'}]
{u'year': 2005, u'page': 399, u'title': u'Python Beginners'}
Python Beginners
[
  {
  "year": 2005,
  "page": 399,
  "title": "Python Beginners"
  },
  {
  "year": 2006,
  "page": 650,
  "title": "Python Developers"
  }
]
=== write test0_list_write.txt ===
[
  {
  "temperature_high": 37.7,
  "temperature_low": -2.6,
  "name": "tokyo"
  },
  {
  "temperature_high": 33.9,
  "temperature_low": 6.1,
  "name": "naha"
  }
]
test0_dict_write.txt
{"prefecture_1": {"temperature_high": 37.7, "temperature_low": -2.6, "name": "tokyo"}}
test0_list_write.txt
[{"temperature_high": 37.7, "temperature_low": -2.6, "name": "tokyo"}, {"temperature_high": 33.9, "temperature_low": 6.1, "name": "naha"}]

[MongoDB]dump

dump手順

  1. dbpathの場所を確認する。
    # ps aux | grep mongod
    
  2. mongodを止める。
    > use admin
    > db.shutdownServer()
    > quit()
    
  3. dump実行。
    # mongodump --dbpath /var/lib/mongodb --out ~/mongodb_dump_20170906
    

[CentOS][MongoDB]インストール

CentOS 7にMongoDBをインストール・起動する手順

インストール

# yum install mongodb
# yum install mongodb-server

サーバー起動

# systemctl start mongod

自動起動を有効にする

# systemctl enable mongod

[MongoDB]基本操作

データベースの新規作成

> use test
switched to db test

データベースの状態確認

> db.stats()
{
  "db" : "test",
  "collections" : 0,
  "objects" : 0,
  "avgObjSize" : 0,
  "dataSize" : 0,
  "storageSize" : 0,
  "numExtents" : 0,
  "indexes" : 0,
  "indexSize" : 0,
  "fileSize" : 0,
  "dataFileVersion" : {

  },
  "ok" : 1
}

データベースの削除

> use test
> db.dropDatabase()

データ挿入

> db.tbl1.insert({message:'hello', value:10})
WriteResult({ "nInserted" : 1 })
> db.tbl1.insert({message:'goodbye', value:20})
WriteResult({ "nInserted" : 1 })

登録データの表示(SELECT * FROM tbl1;)

> db.tbl1.find()
{ "_id" : ObjectId("59af8c93ce7c2c41694720f5"), "message" : "hello", "value" : 10 }
{ "_id" : ObjectId("59af8ca5ce7c2c41694720f6"), "message" : "goodbye", "value" : 20 }

条件指定しての検索(SELECT)

> db.tbl1.find({"message":"hello"})
{ "_id" : ObjectId("59af8c93ce7c2c41694720f5"), "message" : "hello", "value" : 10 }
> db.tbl1.find({"value":{$gt:15}})
{ "_id" : ObjectId("59af8ca5ce7c2c41694720f6"), "message" : "goodbye", "value" : 20 }
> db.tbl1.find({"value":{$gte:10}})
{ "_id" : ObjectId("59af8c93ce7c2c41694720f5"), "message" : "hello", "value" : 10 }
{ "_id" : ObjectId("59af8ca5ce7c2c41694720f6"), "message" : "goodbye", "value" : 20 }

データの更新(UPDATE)

> db.tbl1.find({"message":"goodbye"})
{ "_id" : ObjectId("59af8ca5ce7c2c41694720f6"), "message" : "goodbye", "value" : 20 }
> db.tbl1.update({"message":"goodbye"},{$set:{"value":25}})
WriteResult({ "nMatched" : 1, "nUpserted" : 0, "nModified" : 1 })
> db.tbl1.find({"message":"goodbye"})
{ "_id" : ObjectId("59af8ca5ce7c2c41694720f6"), "message" : "goodbye", "value" : 25 }

DB一覧表示

> show dbs;

コレクション一覧表示

> use test
switched to db test
> show collections;

2017年6月28日水曜日

[D3.js]csvファイルをテーブルで表示する

test1.html
<html>
  <head>
    <meta http-equiv="Content-Type" content="text/html; charset=UTF-8">
    <script src="https://d3js.org/d3.v4.js"></script>
    <link rel="stylesheet" type="text/css" href="./test1.css">
  </head>
  <body>
  <svg width="960" height="500"></svg><br/>
  <a href="test1.csv">下表をcsvファイルにしてダウンロード</a><br/>
  <table></table>
  </body>
  <!-- 上記のsvg要素をJavaScript内で読み込むので、bodyより下にスクリプトのソースを定義する -->
  <script src="./test1.js"></script>
</html>
test1.js
var svg = d3.select("svg"),
    margin = {top: 20, right: 80, bottom: 30, left: 50},
    width = svg.attr("width") - margin.left - margin.right,
    height = svg.attr("height") - margin.top - margin.bottom,
    g = svg.append("g").attr("transform", "translate(" + margin.left + "," + margin.top + ")");

var line = d3.line()
             .x(function(d) { return x(d.month); })
             .y(function(d) { return y(d.temperature); });

// X, Yの範囲を座標に置き換える
var x = d3.scaleLinear()
    .range([0, width]);

var y = d3.scaleLinear()
    .range([height, 0]);

// 色
var colors = d3.scaleOrdinal(d3.schemeCategory10);
console.log(colors(0))
console.log(colors(1))
console.log(colors(2))
console.log(colors(3))

// データファイルを読み込んでグラフを描く
d3.csv("test1.csv", type, function(error, data) {
 if (error) throw error;

 var cities = data.columns.slice(1).map(function(id) {
  return {
   id: id,
   values: data.map(function(d) {
    return {month: d.month, temperature: d[id]};
   })
  };
 });

 var keys = data.columns.slice(1);
 console.log('keys=' + keys);

 // Xの範囲はmonthの最小値から最大値
 console.log('extent=' + d3.extent(data, function(d) { return d.month; }));
 console.log('max=' + d3.max(data, function(d) { return d.month; }));
 x.domain(d3.extent(data, function(d) {
  return d.month
 }));
 console.log('x.domain()=' + x.domain())
 console.log('x.range()=' + x.range())

 // Yの範囲は各地のtemperatureをすべて含めた最小値から最大値
 y_min = d3.min(cities, function(c) { 
  return d3.min(c.values, function(d) {
   return d.temperature;
  });
 });
 y_max = d3.max(cities, function(c) { return d3.max(c.values, function(d) { return d.temperature; }); });
 console.log('y_min=' + y_min);
 console.log('y_max=' + y_max);
 y.domain([y_min, y_max]);

 // X軸 (y=0の場所配置するためにtranslateでy(0)を指定する
 g.append("g")
  .attr("transform", "translate(0," + y(0) + ")")
  .call(d3.axisBottom(x));

 // Y軸
 g.append("g")
  .call(d3.axisLeft(y))
  .append("text")
    .attr("transform", "rotate(-90)")
    .attr("y", 6)
    .attr("dy", "0.71em")
    .attr("fill", "#000")
    .text("Temperature (℃)");

 // line chartを描く
 var city = g.selectAll(".city")
             .data(cities)
             .enter().append("g")
               .attr("class", "city");

 city.append("path")
  .attr("d", function(d) {
    return line(d.values);
  })
  .attr("stroke", function(d, i) {
   console.log('d.id=' + d.id);
   console.log('i=' + i);
   console.log('colors(d.id)=' + colors(d.id));
   console.log('colors(i)=' + colors(i));
     return colors(i);
  })
  .attr("stroke-width", 2)
  .attr("fill", "none");

 // 凡例
 console.log('keys.slice()=' + keys.slice());
 var legend = g.append("g")
               .attr("font-family", "sans-serif")
               .attr("font-size", 10)
               .attr("text-anchor", "end")
               .selectAll("g")
               //.data(['tokyo', 'osaka', 'sapporo', 'naha'])
               .data(keys.slice())
               .enter()
               .append("g")
               .attr("transform", function(d, i) {
                  console.log(i)
                     return "translate(0," + i * 20 + ")"; });
 legend.append("path")
       .attr("d", function(d) { return "M" + (width-19) + ",10" + "L" + (width) + ",10"; })
       .attr("stroke", function(d, i) {
          console.log('colors(' + i + ')=' + colors(i));
          return colors(i);
       })
       .attr("stroke-width", 2)
       .attr("fill", "none");

 legend.append("text")
       .attr("x", width - 24)
       .attr("y", 9.5)
       .attr("dy", "0.32em")
       .text(function(d) { return d; });
});

var table = d3.select("table");
var thead = table.append("thead");
var tbody = table.append("tbody");

d3.csv("test1.csv", function(csv) {
 var headerKey = d3.map(csv[0]).keys();

 thead.append("tr")
      .selectAll("th")
      .data(headerKey)
      .enter()
      .append("th")
      .text(function(key) { return key; });

 tbody.selectAll("tr")
      .data(csv)
      .enter()
      .append("tr")
        .selectAll("td")
        .data(function(row) { return d3.entries(row); })
        .enter()
        .append("td")
        .text(function(d) { return d.value; })
})

function type(d, _, columns) {
 d.month = +d.month; // 文字列を数値にする
 for (var i = 1, n = columns.length, c; i < n; ++i) {
  d[c = columns[i]] = +d[c];
 }

 return d;
}
test1.css
table {
 border-collapse: collapse;
 text-align: left;
 line-height: 1.5;
}

th {
 padding: 10px;
 font-weight: bold;
 vertical-align: top;
 color: #369;
 border-bottom: 3px solid #036;
}

td {
 weight: 350px;
 padding: 10px;
 vertical-align: top;
 border-bottom: 1px solid #ccc;
}
test1.csv
month,tokyo,osaka,sapporo,naha
1,5.1,4.4,-3.8,14.9
2,7,7.4,-1.1,17.6
3,8.1,8.1,0.7,17.1
4,14.5,13.8,6.9,20.4
5,18.5,19.6,11.1,23.9
6,22.8,24.2,17.3,27.9
7,27.3,27.8,21.8,28.9
8,27.5,28.9,26.6,28.3
9,25.1,25.2,19.2,27.9
10,19.5,19.5,12.1,25.2
11,14.9,15.2,6,23.7
12,7.5,8.1,-2,18.6
実行例 (fc2に置いてあるページに飛びます)

[D3.js]csvファイルを読み込んで折れ線グラフを描く

test12.html
<html>
  <head>
    <meta http-equiv="Content-Type" content="text/html; charset=UTF-8">
    <script src="https://d3js.org/d3.v4.js"></script>
  </head>
  <body>
  <svg width="960" height="500"></svg>
  </body>
  <!-- 上記のsvg要素をJavaScript内で読み込むので、bodyより下にスクリプトのソースを定義する -->
  <script src="./test12.js"></script>
</html>
test12.js
var svg = d3.select("svg"),
    margin = {top: 20, right: 80, bottom: 30, left: 50},
    width = svg.attr("width") - margin.left - margin.right,
    height = svg.attr("height") - margin.top - margin.bottom,
    g = svg.append("g").attr("transform", "translate(" + margin.left + "," + margin.top + ")");

var line = d3.line()
             .x(function(d) { return x(d.month); })
             .y(function(d) { return y(d.temperature); });

// X, Yの範囲を座標に置き換える
var x = d3.scaleLinear()
    .range([0, width]);

var y = d3.scaleLinear()
    .range([height, 0]);

// 色
var colors = d3.scaleOrdinal(d3.schemeCategory10);
console.log(colors(0))
console.log(colors(1))
console.log(colors(2))
console.log(colors(3))

// データファイルを読み込んでグラフを描く
d3.csv("test12.csv", type, function(error, data) {
 if (error) throw error;

 var cities = data.columns.slice(1).map(function(id) {
  return {
   id: id,
   values: data.map(function(d) {
    return {month: d.month, temperature: d[id]};
   })
  };
 });

 var keys = data.columns.slice(1);
 console.log('keys=' + keys);

 // Xの範囲はmonthの最小値から最大値
 console.log('extent=' + d3.extent(data, function(d) { return d.month; }));
 console.log('max=' + d3.max(data, function(d) { return d.month; }));
 x.domain(d3.extent(data, function(d) {
  return d.month
 }));
 console.log('x.domain()=' + x.domain())
 console.log('x.range()=' + x.range())

 // Yの範囲は各地のtemperatureをすべて含めた最小値から最大値
 y_min = d3.min(cities, function(c) { 
  return d3.min(c.values, function(d) {
   return d.temperature;
  });
 });
 y_max = d3.max(cities, function(c) { return d3.max(c.values, function(d) { return d.temperature; }); });
 console.log('y_min=' + y_min);
 console.log('y_max=' + y_max);
 y.domain([y_min, y_max]);

 // X軸 (y=0の場所配置するためにtranslateでy(0)を指定する
 g.append("g")
  .attr("transform", "translate(0," + y(0) + ")")
  .call(d3.axisBottom(x));

 // Y軸
 g.append("g")
  .call(d3.axisLeft(y))
  .append("text")
    .attr("transform", "rotate(-90)")
    .attr("y", 6)
    .attr("dy", "0.71em")
    .attr("fill", "#000")
    .text("Temperature (℃)");

 // line chartを描く
 var city = g.selectAll(".city")
             .data(cities)
             .enter().append("g")
               .attr("class", "city");

 city.append("path")
  .attr("d", function(d) {
    return line(d.values);
  })
  .attr("stroke", function(d, i) {
   console.log('d.id=' + d.id);
   console.log('i=' + i);
   console.log('colors(d.id)=' + colors(d.id));
   console.log('colors(i)=' + colors(i));
     return colors(i);
  })
  .attr("stroke-width", 2)
  .attr("fill", "none");

 // 凡例
 console.log('keys.slice()=' + keys.slice());
 var legend = g.append("g")
               .attr("font-family", "sans-serif")
               .attr("font-size", 10)
               .attr("text-anchor", "end")
               .selectAll("g")
               //.data(['tokyo', 'osaka', 'sapporo', 'naha'])
               .data(keys.slice())
               .enter()
               .append("g")
               .attr("transform", function(d, i) {
                  console.log(i)
                     return "translate(0," + i * 20 + ")"; });
 legend.append("path")
       .attr("d", function(d) { return "M" + (width-19) + ",10" + "L" + (width) + ",10"; })
       .attr("stroke", function(d, i) {
          console.log('colors(' + i + ')=' + colors(i));
          return colors(i);
       })
       .attr("stroke-width", 2)
       .attr("fill", "none");

 legend.append("text")
       .attr("x", width - 24)
       .attr("y", 9.5)
       .attr("dy", "0.32em")
       .text(function(d) { return d; });
});

function type(d, _, columns) {
 d.month = +d.month; // 文字列を数値にする
 for (var i = 1, n = columns.length, c; i < n; ++i) {
  d[c = columns[i]] = +d[c];
 }

 return d;
}
test12.csv
month,tokyo,osaka,sapporo,naha
1,5.1,4.4,-3.8,14.9
2,7,7.4,-1.1,17.6
3,8.1,8.1,0.7,17.1
4,14.5,13.8,6.9,20.4
5,18.5,19.6,11.1,23.9
6,22.8,24.2,17.3,27.9
7,27.3,27.8,21.8,28.9
8,27.5,28.9,26.6,28.3
9,25.1,25.2,19.2,27.9
10,19.5,19.5,12.1,25.2
11,14.9,15.2,6,23.7
12,7.5,8.1,-2,18.6
実行例 (fc2に置いてあるページに飛びます)

2017年6月23日金曜日

[D3.js]折れ線グラフに凡例をつける

test11.html
<html>
  <head>
    <meta http-equiv="Content-Type" content="text/html; charset=UTF-8">
    <script src="https://d3js.org/d3.v4.js"></script>
  </head>
  <body>
  <svg width="960" height="500"></svg>
  </body>
  <!-- 上記のsvg要素をJavaScript内で読み込むので、bodyより下にスクリプトのソースを定義する -->
  <script src="./test11.js"></script>
</html>
test11.js
var svg = d3.select("svg"),
    margin = {top: 20, right: 80, bottom: 30, left: 50},
    width = svg.attr("width") - margin.left - margin.right,
    height = svg.attr("height") - margin.top - margin.bottom,
    g = svg.append("g").attr("transform", "translate(" + margin.left + "," + margin.top + ")");

// データ
var tokyo = [
 {"month": 1,  "temperature": 5.1},
 {"month": 2,  "temperature": 7.0},
 {"month": 3,  "temperature": 8.1},
 {"month": 4,  "temperature": 14.5},
 {"month": 5,  "temperature": 18.5},
 {"month": 6,  "temperature": 22.8},
 {"month": 7,  "temperature": 27.3},
 {"month": 8,  "temperature": 27.5},
 {"month": 9,  "temperature": 25.1},
 {"month": 10, "temperature": 19.5},
 {"month": 11, "temperature": 14.9},
 {"month": 12, "temperature": 7.5},
];

var osaka = [
 {"month": 1,  "temperature": 4.4},
 {"month": 2,  "temperature": 7.4},
 {"month": 3,  "temperature": 8.1},
 {"month": 4,  "temperature": 13.8},
 {"month": 5,  "temperature": 19.6},
 {"month": 6,  "temperature": 24.2},
 {"month": 7,  "temperature": 27.8},
 {"month": 8,  "temperature": 28.9},
 {"month": 9,  "temperature": 25.2},
 {"month": 10, "temperature": 19.5},
 {"month": 11, "temperature": 15.2},
 {"month": 12, "temperature": 8.1}
];

var sapporo = [
 {"month": 1,  "temperature": -3.8},
 {"month": 2,  "temperature": -1.1},
 {"month": 3,  "temperature": 0.7},
 {"month": 4,  "temperature": 6.9},
 {"month": 5,  "temperature": 11.1},
 {"month": 6,  "temperature": 17.3},
 {"month": 7,  "temperature": 21.8},
 {"month": 8,  "temperature": 26.6},
 {"month": 9,  "temperature": 19.2},
 {"month": 10, "temperature": 12.1},
 {"month": 11, "temperature": 6},
 {"month": 12, "temperature": -2}
];

var naha = [
 {"month": 1,  "temperature": 14.9},
 {"month": 2,  "temperature": 17.6},
 {"month": 3,  "temperature": 17.1},
 {"month": 4,  "temperature": 20.4},
 {"month": 5,  "temperature": 23.9},
 {"month": 6,  "temperature": 27.9},
 {"month": 7,  "temperature": 28.9},
 {"month": 8,  "temperature": 28.3},
 {"month": 9,  "temperature": 27.9},
 {"month": 10, "temperature": 25.2},
 {"month": 11, "temperature": 23.7},
 {"month": 12, "temperature": 18.6}
];

var line = d3.line()
             .x(function(d) { return x(d.month); })
             .y(function(d) { return y(d.temperature); });

// X, Yの範囲を座標に置き換える
var x = d3.scaleLinear()
    .range([0, width]);

var y = d3.scaleLinear()
    .range([height, 0]);
// Xの範囲はmonthの最小値から最大値
x.domain(d3.extent(tokyo, function(d) { return d.month; }));
// Yの範囲は各地のtemperatureをすべて含めた最小値から最大値
m = [
 d3.max(tokyo, function(d) { return d.temperature; }),
 d3.max(osaka, function(d) { return d.temperature; }),
 d3.max(sapporo, function(d) { return d.temperature; }),
 d3.max(naha, function(d) { return d.temperature; })
];
console.log('m=' + m)
y_max = d3.max(m);
console.log('y_max=' + y_max);

m = [
 d3.min(tokyo, function(d) { return d.temperature; }),
 d3.min(osaka, function(d) { return d.temperature; }),
 d3.min(sapporo, function(d) { return d.temperature; }),
 d3.min(naha, function(d) { return d.temperature; })
];
console.log('m=' + m)
y_min = d3.min(m);
console.log('y_min=' + y_min);

y.domain([y_min, y_max]);

// 色
var colors = d3.scaleOrdinal(d3.schemeCategory10);
console.log(colors(0))
console.log(colors(1))
console.log(colors(2))
console.log(colors(3))

// line chartを描く
g.append("path")
   .attr("d", line(tokyo))
   .attr("stroke", colors(0))
   .attr("stroke-width", 2)
   .attr("fill", "none");
g.append("path")
   .attr("d", line(osaka))
   .attr("stroke", colors(1))
   .attr("stroke-width", 2)
   .attr("fill", "none");
g.append("path")
   .attr("d", line(sapporo))
   .attr("stroke", colors(2))
   .attr("stroke-width", 2)
   .attr("fill", "none");
g.append("path")
   .attr("d", line(naha))
   .attr("stroke", colors(3))
   .attr("stroke-width", 2)
   .attr("fill", "none");

// X軸 (y=0の場所配置するためにtranslateでy(0)を指定する
g.append("g")
      .attr("transform", "translate(0," + y(0) + ")")
      .call(d3.axisBottom(x));

// Y軸
g.append("g")
      .call(d3.axisLeft(y))
    .append("text")
      .attr("transform", "rotate(-90)")
      .attr("y", 6)
      .attr("dy", "0.71em")
      .attr("fill", "#000")
      .text("Temperature (℃)");

// 凡例
var legend = g.append("g")
              .attr("font-family", "sans-serif")
              .attr("font-size", 10)
              .attr("text-anchor", "end")
              .selectAll("g")
              .data(['tokyo', 'osaka', 'sapporo', 'naha'])
              .enter()
              .append("g")
                .attr("transform", function(d, i) {
                console.log(i)
                 return "translate(0," + i * 20 + ")"; });

legend.append("path")
      .attr("d", function(d) { return "M" + (width-19) + ",10" + "L" + (width) + ",10"; })
      .attr("stroke", function(d, i) {
         console.log('colors(' + i + ')=' + colors(i));
         return colors(i);
       })
      .attr("stroke-width", 2)
      .attr("fill", "none");

legend.append("text")
      .attr("x", width - 24)
      .attr("y", 9.5)
      .attr("dy", "0.32em")
      .text(function(d) { return d; });
実行例 (fc2に置いてあるページに飛びます)

[D3.js]複数要素の折れ線グラフ

複数要素のデータがjsファイルに埋め込まれた例

test10.html
<html>
  <head>
    <meta http-equiv="Content-Type" content="text/html; charset=UTF-8">
    <script src="https://d3js.org/d3.v4.js"></script>
  </head>
  <body>
  <svg width="960" height="500"></svg>
  </body>
  <!-- 上記のsvg要素をJavaScript内で読み込むので、bodyより下にスクリプトのソースを定義する -->
  <script src="./test10.js"></script>
</html>
test10.js
var svg = d3.select("svg"),
    margin = {top: 20, right: 80, bottom: 30, left: 50},
    width = svg.attr("width") - margin.left - margin.right,
    height = svg.attr("height") - margin.top - margin.bottom,
    g = svg.append("g").attr("transform", "translate(" + margin.left + "," + margin.top + ")");

// データ
var tokyo = [
 {"month": 1,  "temperature": 5.1},
 {"month": 2,  "temperature": 7.0},
 {"month": 3,  "temperature": 8.1},
 {"month": 4,  "temperature": 14.5},
 {"month": 5,  "temperature": 18.5},
 {"month": 6,  "temperature": 22.8},
 {"month": 7,  "temperature": 27.3},
 {"month": 8,  "temperature": 27.5},
 {"month": 9,  "temperature": 25.1},
 {"month": 10, "temperature": 19.5},
 {"month": 11, "temperature": 14.9},
 {"month": 12, "temperature": 7.5},
];

var osaka = [
 {"month": 1,  "temperature": 4.4},
 {"month": 2,  "temperature": 7.4},
 {"month": 3,  "temperature": 8.1},
 {"month": 4,  "temperature": 13.8},
 {"month": 5,  "temperature": 19.6},
 {"month": 6,  "temperature": 24.2},
 {"month": 7,  "temperature": 27.8},
 {"month": 8,  "temperature": 28.9},
 {"month": 9,  "temperature": 25.2},
 {"month": 10, "temperature": 19.5},
 {"month": 11, "temperature": 15.2},
 {"month": 12, "temperature": 8.1}
];

var sapporo = [
 {"month": 1,  "temperature": -3.8},
 {"month": 2,  "temperature": -1.1},
 {"month": 3,  "temperature": 0.7},
 {"month": 4,  "temperature": 6.9},
 {"month": 5,  "temperature": 11.1},
 {"month": 6,  "temperature": 17.3},
 {"month": 7,  "temperature": 21.8},
 {"month": 8,  "temperature": 26.6},
 {"month": 9,  "temperature": 19.2},
 {"month": 10, "temperature": 12.1},
 {"month": 11, "temperature": 6},
 {"month": 12, "temperature": -2}
];

var naha = [
 {"month": 1,  "temperature": 14.9},
 {"month": 2,  "temperature": 17.6},
 {"month": 3,  "temperature": 17.1},
 {"month": 4,  "temperature": 20.4},
 {"month": 5,  "temperature": 23.9},
 {"month": 6,  "temperature": 27.9},
 {"month": 7,  "temperature": 28.9},
 {"month": 8,  "temperature": 28.3},
 {"month": 9,  "temperature": 27.9},
 {"month": 10, "temperature": 25.2},
 {"month": 11, "temperature": 23.7},
 {"month": 12, "temperature": 18.6}
];

var line = d3.line()
             .x(function(d) { return x(d.month); })
             .y(function(d) { return y(d.temperature); });

// X, Yの範囲を座標に置き換える
var x = d3.scaleLinear()
    .range([0, width]);

var y = d3.scaleLinear()
    .range([height, 0]);
// Xの範囲はmonthの最小値から最大値
x.domain(d3.extent(tokyo, function(d) { return d.month; }));
// Yの範囲は各地のtemperatureをすべて含めた最小値から最大値
m = [
 d3.max(tokyo, function(d) { return d.temperature; }),
 d3.max(osaka, function(d) { return d.temperature; }),
 d3.max(sapporo, function(d) { return d.temperature; }),
 d3.max(naha, function(d) { return d.temperature; })
];
console.log('m=' + m)
y_max = d3.max(m);
console.log('y_max=' + y_max);

m = [
 d3.min(tokyo, function(d) { return d.temperature; }),
 d3.min(osaka, function(d) { return d.temperature; }),
 d3.min(sapporo, function(d) { return d.temperature; }),
 d3.min(naha, function(d) { return d.temperature; })
];
console.log('m=' + m)
y_min = d3.min(m);
console.log('y_min=' + y_min);

y.domain([y_min, y_max]);

// 色
var colors = d3.scaleOrdinal(d3.schemeCategory10);
console.log(colors(0))
console.log(colors(1))
console.log(colors(2))
console.log(colors(3))

// line chartを描く
g.append("path")
   .attr("d", line(tokyo))
   .attr("stroke", colors(0))
   .attr("stroke-width", 2)
   .attr("fill", "none");
g.append("path")
   .attr("d", line(osaka))
   .attr("stroke", colors(1))
   .attr("stroke-width", 2)
   .attr("fill", "none");
g.append("path")
   .attr("d", line(sapporo))
   .attr("stroke", colors(2))
   .attr("stroke-width", 2)
   .attr("fill", "none");
g.append("path")
   .attr("d", line(naha))
   .attr("stroke", colors(3))
   .attr("stroke-width", 2)
   .attr("fill", "none");

// X軸 (y=0の場所配置するためにtranslateでy(0)を指定する
g.append("g")
      .attr("transform", "translate(0," + y(0) + ")")
      .call(d3.axisBottom(x));

// Y軸
g.append("g")
      .call(d3.axisLeft(y))
    .append("text")
      .attr("transform", "rotate(-90)")
      .attr("y", 6)
      .attr("dy", "0.71em")
      .attr("fill", "#000")
      .text("Temperature (℃)");
実行例 (fc2に置いてあるページに飛びます)

[D3.js]折れ線グラフ

データがjsファイルに埋め込まれたれ例。
1つの折れ線グラフを描く。

test9.html
<html>
  <head>
    <meta http-equiv="Content-Type" content="text/html; charset=UTF-8">
    <script src="https://d3js.org/d3.v4.js"></script>
  </head>
  <body>
  <svg width="960" height="500"></svg>
  </body>
  <!-- 上記のsvg要素をJavaScript内で読み込むので、bodyより下にスクリプトのソースを定義する -->
  <script src="./test9.js"></script>
</html>
test9.js
var svg = d3.select("svg"),
    margin = {top: 20, right: 80, bottom: 30, left: 50},
    width = svg.attr("width") - margin.left - margin.right,
    height = svg.attr("height") - margin.top - margin.bottom,
    g = svg.append("g").attr("transform", "translate(" + margin.left + "," + margin.top + ")");

// データ
var tokyo = [
 {"month": 1,  "temperature": 5.1},
 {"month": 2,  "temperature": 7.0},
 {"month": 3,  "temperature": 8.1},
 {"month": 4,  "temperature": 14.5},
 {"month": 5,  "temperature": 18.5},
 {"month": 6,  "temperature": 22.8},
 {"month": 7,  "temperature": 27.3},
 {"month": 8,  "temperature": 27.5},
 {"month": 9,  "temperature": 25.1},
 {"month": 10, "temperature": 19.5},
 {"month": 11, "temperature": 14.9},
 {"month": 12, "temperature": 7.5},
];

var line = d3.line()
             .x(function(d) {
              console.log(d.month);
              console.log(x(d.month));
              return x(d.month); })
             .y(function(d) {
              console.log(d.temperature);
              console.log(y(d.temperature));
              return y(d.temperature); });

// X, Yの範囲を座標に置き換える
var x = d3.scaleLinear()
    .range([0, width]);

var y = d3.scaleLinear()
    .range([height, 0]);
// Xの範囲はmonthの最小値から最大値
x.domain(d3.extent(tokyo, function(d) { return d.month; }));
// Yの範囲0からtemperatureの最大値
y.domain([0, d3.max(tokyo, function(d) { return d.temperature; })]);

// line chartを描く
g.append("path")
   .attr("d", line(tokyo))
   .attr("stroke", "blue")
   .attr("stroke-width", 2)
   .attr("fill", "none");

// X軸
g.append("g")
      .attr("transform", "translate(0," + height + ")")
      .call(d3.axisBottom(x));

// Y軸
g.append("g")
      .call(d3.axisLeft(y))
    .append("text")
      .attr("transform", "rotate(-90)")
      .attr("y", 6)
      .attr("dy", "0.71em")
      .attr("fill", "#000")
      .text("Temperature (℃)");
実行例 (fc2に置いてあるテストページに飛びます)

2017年5月31日水曜日

[Python][CGI]SQLクエリーを実行した結果を表示する

test3.html
<!DOCTYPE HTML PUBLIC "-//IETF//DTD HTML//EN">
<html>
  <head>
    <META HTTP-EQUIV="Content-Type" CONTENT="text/html; CHARSET=UTF-8">
    <title>Ajax Test, SQL query</title>
    <script src="http://ajax.googleapis.com/ajax/libs/jquery/1.7.1/jquery.min.js"></script>
    <script type="text/javascript">
      $(function() {
        $('#sendButton').click(function(event) {
          $.post(
            "/cgi-bin/python_test/test3.py",
            { sendValue: $('#animal').val() },
            function(data, textStatus) {
              if (textStatus == 'success') {
                $('#textStatus').text('Success');
              }
              $("#result").html(data);
          }, 'html')
          .fail(function() {
              $("#result").html("Failed");
            }
          );
        });
      });
    </script>
  </head>
  <body>
    動物名<br/>
    <input type="text" name="animal" value="" id="animal"/><br/>
    <button type="button" id="sendButton">送信</button><br/><br/>
    textStatus: <span id="textStatus"></span><br/>
    Result: <span id="result"></span>
  </body>
</html>
test3.py
#!/usr/bin/python
#-*- coding:utf-8 -*-

import cgi
import psycopg2

# エラー発生時にレポートを表示
import cgitb
cgitb.enable()

html0 = """
<META HTTP-EQUIV="Content-Type" CONTENT="text/html; CHARSET=utf-8"/>
"""

#######################################################################
# DBに接続
#######################################################################
def connectDb():
 connection = psycopg2.connect("dbname=testdb user=username password=password")
 cur = connection.cursor()

 return connection, cur

#######################################################################
# DBから切断
#######################################################################
def disconnectDb(connection, cur):
 # commit
 connection.commit()

 cur.close()
 connection.close()

#######################################################################
# SQL query
#######################################################################
def select(cur, animal):
 sql = "SELECT id FROM animals WHERE name='" + animal + "';"
 print(sql + '<br/>')
 cur.execute(sql)
 result = cur.fetchone()
 if result == None:
  print(animal + ' is not found.<br/>')
 else:
  print(animal + "'s id is " + str(result[0]))

#######################################################################
# Main function
#######################################################################
if __name__ == '__main__':
 print(html0)
 form = cgi.FieldStorage()
 animal = form['sendValue'].value
 print('animal: ' + animal + '<br/>')

 # DBに接続する
 connection, cur = connectDb()

 # SQL query (SELECT)
 id = select(cur, facility)

 # DBから切断する
 disconnectDb(connection, cur)
実行結果(ブラウザに渡されるHTMLソース)
<html>
  <head>
    <meta http-equiv="Content-Type" content="text/html; CHARSET=UTF-8">
    <title>Ajax Test, SQL query</title>
    <script src="http://ajax.googleapis.com/ajax/libs/jquery/1.7.1/jquery.min.js"></script>
    <script type="text/javascript">
      $(function() {
        $('#sendButton').click(function(event) {
          $.post(
            "/cgi-bin/python_test/test3.py",
            { sendValue: $('#animal').val() },
            function(data, textStatus) {
              if (textStatus == 'success') {
                $('#textStatus').text('Success');
              }
              $("#result").html(data);
          }, 'html')
          .fail(function() {
              $("#result").html("Failed");
            }
          );
        });
      });
    </script>
  </head>
  <body>
    動物名<br>
    <input type="text" name="animal" value="" id="animal"><br>
    <button type="button" id="sendButton">送信</button><br><br>
    textStatus: <span id="textStatus">Success</span><br>
    Result: <span id="result">
      <meta http-equiv="Content-Type" content="text/html; CHARSET=utf-8">
      animal: dog<br>
      SELECT id FROM animals WHERE name='dog';<br>
      dog's id is 3
    </span>
  </body>
</html>

[Python][CGI]Ajax

id="sendButton"の送信ボタンを押した時に、test2.pyに対してname="a"のinput欄に入力したテキストをsendValueという変数に入れて渡す。 python2.pyから返ってきた文字列はid=resultのspan内に格納される。

test2.html
<!DOCTYPE HTML PUBLIC "-//IETF//DTD HTML//EN">
<html>
  <head>
    <META HTTP-EQUIV="Content-Type" CONTENT="text/html; CHARSET=UTF-8">
    <title>Ajax Test</title>
    <script src="http://ajax.googleapis.com/ajax/libs/jquery/1.7.1/jquery.min.js"></script>
    <script type="text/javascript">
      $(function() {
        $('#sendButton').click(function(event) {
          $.post(
            "/cgi-bin/python_test/test2.py",
            { sendValue: $('#a').val() },
            function(data, textStatus) {
              if (textStatus == 'success') {
                $('#textStatus').text('Success');
              }
              $("#result").html(data);
          }, 'html')
          .fail(function() {
              $("#result").html("Failed");
            }
          );
        });
      });
    </script>
  </head>
  <body>
    入力欄に文字列を入れると、POST されて応答が返ってきます<br/>
    <input type="text" name="a" value="" id="a"/><br/>
    <button type="button" id="sendButton">送信</button><br/><br/>
    textStatus: <span id="textStatus"></span><br/>
    Result: <span id="result"></span>
  </body>
</html>
test2.py
#!/usr/bin/python
#-*- coding:utf-8 -*-

import cgi

# エラー発生時にレポートを表示
import cgitb
cgitb.enable()

html0 = """
<META HTTP-EQUIV="Content-Type" CONTENT="text/html; CHARSET=utf-8"/>
"""

#######################################################################
# Main function
#######################################################################
if __name__ == '__main__':
 print(html0)
 form = cgi.FieldStorage()
 #print(form)
 value = form['sendValue'].value
 print('Hello, ' + value)
実行結果(ブラウザに渡されるHTMLソース)
<html>
  <head>
    <meta http-equiv="Content-Type" content="text/html; CHARSET=UTF-8">
    <title>Ajax Test</title>
    <script src="http://ajax.googleapis.com/ajax/libs/jquery/1.7.1/jquery.min.js"></script>
    <script type="text/javascript">
      $(function() {
        $('#sendButton').click(function(event) {
          $.post(
            "/cgi-bin/python_test/test2.py",
            { sendValue: $('#a').val() },
            function(data, textStatus) {
              if (textStatus == 'success') {
                $('#textStatus').text('Success');
              }
              $("#result").html(data);
          }, 'html')
          .fail(function() {
              $("#result").html("Failed");
            }
          );
        });
      });
    </script>
  </head>
  <body>
    入力欄に文字列を入れると、POST されて応答が返ってきます<br>
    <input type="text" name="a" value="" id="a"><br>
    <button type="button" id="sendButton">送信</button><br><br>
    textStatus: <span id="textStatus">Success</span><br>
    Result: <span id="result">
      <meta http-equiv="Content-Type" content="text/html; CHARSET=utf-8">
      Hello, abc
    </span>
  </body>
</html>

[Python][CGI]FORMからのPOSTデータ受け取り

test1.html
<html>
  <head>
    <meta http-equiv="Content-Type" content="text/html; charset=UTF-8">
  </head>
  <body>
  <form name="form" method="POST" action="/cgi-bin/python_test/test1.py">
    name: <input type="text" size="30" name="name"/><br/>
    mail: <input type="text" size="30" name="mail"/><br/>
    <input type="submit" value="submit" name="button"/>
  </form>
  </body>
</html>
上記のページで[Submit]ボタンを押すとtest1.pyが実行される。
test1.py
#!/usr/bin/python
#-*- coding:utf-8 -*-

import cgi

# エラー発生時にレポートを表示
import cgitb
cgitb.enable()

html0 = """
<META HTTP-EQUIV="Content-Type" CONTENT="text/html; CHARSET=utf-8"/>
<html>
<head>
<title>Test 1</title>
</head>
<body>
"""

html1 = """
</body>
</html>
"""

#######################################################################
# Main function
#######################################################################
if __name__ == '__main__':
 print(html0)
 form = cgi.FieldStorage()
 print('<b>name: </b>' + form['name'].value + '<br/>')
 print('<b>mail: </b>' + form['mail'].value + '<br/>')
 print(html1)
実行結果(ブラウザに渡されるHTMLソース)
<html>
  <head>
    <meta http-equiv="Content-Type" content="text/html; CHARSET=utf-8">
    <title>Test 1</title>
  </head>
  <body>
    <b>name: </b>aa<br>
    <b>mail: </b>bb<br>
  </body>
</html>

[Python][CGI]Hello, world

test0.py
#!/usr/bin/python
#-*- coding:utf-8 -*-

# エラー発生時にレポートを表示
import cgitb
cgitb.enable()

html = """
<META HTTP-EQUIV="Content-Type" CONTENT="text/html; CHARSET=utf-8"/>
<html>
<head>
<title>Test 0</title>
</head>
<body>
Hello, world<br/>
</body>
</html>
"""

#######################################################################
# Main function
#######################################################################
if __name__ == '__main__':
 print(html)
実行結果(ブラウザに渡されるHTMLソース)
<html>
  <head>
    <meta http-equiv="Content-Type" content="text/html; CHARSET=utf-8">
    <title>Test 0</title>
  </head>
  <body>
    Hello, world<br>
  </body>
</html>

2017年5月10日水曜日

[R]plot グラフタイトル・軸ラベル

# 出力ファイル名
filename = "test1-"
file_no = 0

# 数値ベクトル同士のplot
x <- c(1:10)   # 1から10までの整数ベクトルを生成する
y <- rnorm(10) # rnorm(n): 正規分布に従う乱数をn個生成する
cat("x = ", x, "\n")
cat("y = ", y, "\n")

# 基本のplot
output = paste(filename, file_no, ".png", sep="") # 文字列間に空白が入るのでsep=""を指定して空白なしにする
file_no = file_no + 1
cat("output = ", output, "\n")
png(output)
plot(x, y)
dev.off()

# グラフタイトル
output = paste(filename, file_no, ".png", sep="") # 文字列間に空白が入るのでsep=""を指定して空白なしにする
file_no = file_no + 1
cat("output = ", output, "\n")
png(output)
plot(x, y, main="Main title")
dev.off()

# X軸項目名
output = paste(filename, file_no, ".png", sep="") # 文字列間に空白が入るのでsep=""を指定して空白なしにする
file_no = file_no + 1
cat("output = ", output, "\n")
png(output)
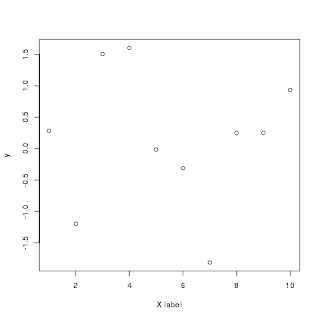
plot(x, y, xlab="X label")
dev.off()

# Y軸項目名
output = paste(filename, file_no, ".png", sep="") # 文字列間に空白が入るのでsep=""を指定して空白なしにする
file_no = file_no + 1
cat("output = ", output, "\n")
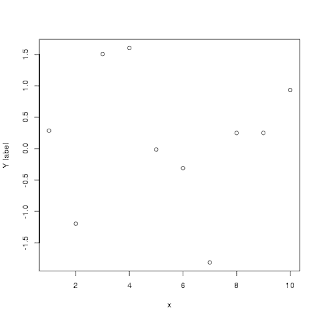
png(output)
plot(x, y, ylab="Y label")
dev.off()
実行結果
$ Rscript test1.R
x =  1 2 3 4 5 6 7 8 9 10
y =  0.2868086 -1.195694 1.50674 1.604657 -0.01464439 -0.3106049 -1.813415 0.2500726 0.2512269 0.9339756 output =  test1-0.png null device
          1
output =  test1-1.png
null device
          1
output =  test1-2.png
null device
          1
output =  test1-3.png
null device
          1

test1-0.png

test1-1.png

test1-2.png

test1-3.png

[R]zoo

# zooパッケージを読み込む
library(zoo)

x <- read.zoo('test0.csv', sep=',', format="%Y-%m-%d %H:%M:%S", tz='Japan', col.names=c("datetime", "value"))
cat("x = \n")
print(x)

# Plot
png(filename='test0-plot.png')
plot(x)
dev.off()
実行結果
$ Rscript test0.R

Attaching package: ‘zoo’

The following objects are masked from ‘package:base’:

  as.Date, as.Date.numeric

x =
2017-04-28 00:00:03 2017-04-28 00:00:11 2017-04-28 00:00:14 2017-04-28 00:00:20
  -1.4862333 0.1039043 -1.4335332 -0.2203692
2017-04-28 00:00:37 2017-04-28 00:00:49 2017-04-28 00:00:57 2017-04-28 00:01:13
  -1.3775672 -0.8206941 1.0668013 -0.8139086
2017-04-28 00:01:31 2017-04-28 00:01:32
  -0.1771520 0.5120787
null device
  1
test0-plot.png

# zooパッケージを読み込む
library(zoo)

###############
# 日単位の時系列データを表示

# Date: 日付型
t = as.Date("2017-04-28") + c(1, 3, 7, 9, 14) - 1
cat("t = ", t, "\n")

v <- rnorm(5)
cat("v = ", v, "\n")

x <- zoo(v, t)
cat("x = \n")
print(x)

png('test1-plot.png')
plot(x)
dev.off()

#####################
# 秒単位の時系列データを表示

# 要素数
n <- 10

# rexp(n, rate): 指数分布に従うランダム数を生成する
# n: 生成する乱数の数
# rate: 比率のベクトル
r <- rexp(n, rate=0.1)
cat("r = ", r, "\n")

# cumsum(): ベクトルの累積和
t <- cumsum(r)
cat("t = ", t, "\n")

# rnorm(n): 正規分布に従う乱数をn個生成する
v <- rnorm(n)
cat("v = ", v, "\n")

# ベクトルtの各要素にPOSIXct("2017-04-28 00:00:00", tz="JST")を加える
cat("POSIXct(2017-04-28 00:00:00, tz=JST) = ", as.POSIXct("2017-04-28 00:00:00", tz="JST"), "\n")
t <- t + as.POSIXct("2017-04-28 00:00:00", tz="JST")
cat("t = ", t, "\n")

# zoo(value, time): zooオブジェクト(Z's ordered observations)を生成する
# value: 値のベクトル
# time: 時間のベクトル
x <- zoo(v, t)
cat("x = \n")
print(x)

# Plot
lim = as.POSIXct(c("2017-04-28 00:00:00", "2017-04-28 00:05:00"), tz="JST")
cat("lim = ", lim, "\n")

png(filename='test1-plot1.png')
plot(x, xlim=lim)
dev.off()
実行結果
$ Rscript test1.R

Attaching package: ‘zoo’

The following objects are masked from ‘package:base’:

  as.Date, as.Date.numeric

t = 17284 17286 17290 17292 17297
v = 0.87807 -0.1978724 2.154195 -1.168555 -0.7520462
x =
2017-04-28 2017-04-30 2017-05-04 2017-05-06 2017-05-11
 0.8780700 -0.1978724 2.1541946 -1.1685551 -0.7520462
null device
  1
r = 11.0301 18.67322 3.54064 14.88312 1.521852 0.3181695 13.12669 5.038134 27.43955 15.86685
t = 11.0301 29.70332 33.24396 48.12708 49.64893 49.9671 63.09379 68.13193 95.57147 111.4383
v = 1.069938 -0.1263455 -0.799708 -0.8663653 0.2562313 0.1949112 0.6599253 1.93077 -0.7650325 -1.813658
POSIXct(2017-04-28 00:00:00, tz=JST) = 1493337600
t = 1493337611 1493337630 1493337633 1493337648 1493337650 1493337650 1493337663 1493337668 1493337696 1493337711
x =
2017-04-28 00:00:11 2017-04-28 00:00:29 2017-04-28 00:00:33 2017-04-28 00:00:48
  1.0699382 -0.1263455 -0.7997080 -0.8663653
2017-04-28 00:00:49 2017-04-28 00:00:49 2017-04-28 00:01:03 2017-04-28 00:01:08
  0.2562313 0.1949112 0.6599253 1.9307703
2017-04-28 00:01:35 2017-04-28 00:01:51
  -0.7650325 -1.8136584
lim = 1493337600 1493337900
null device
test1-plot.png


test1-plot1.png

[R]irts

# tseriesパッケージを読み込む
library(tseries)

# 要素数
n <- 10

# rexp(n, rate): 指数分布に従うランダム数を生成する
# n: 生成する乱数の数
# rate: 比率のベクトル
r <- rexp(n, rate = 0.1)
cat("r = ", r, "\n")

# cumsum(): ベクトルの累積和
t <- cumsum(r)
cat("t = ", t, "\n")

# rnorm(n): 正規分布に従う乱数をn個生成する
v <- rnorm(n)
cat("v = ", v, "\n")

# ベクトルtの各要素にPOSIXct("2017-04-28 00:00:00", tz="JST")を加える
cat("POSIXct(2017-04-28 00:00:00, tz=Japan) = ", as.POSIXct("2017-04-28 00:00:00", tz="Japan"), "\n")
t <- t + as.POSIXct("2017-04-28 00:00:00", tz="Japan")
cat("t = ", t, "\n")

# irts(time, value): Irregular time-series objectを生成する
# time: 時間のベクトル, POSIXctクラスも使える
# value: 値のベクトル
x <- irts(t, v)
cat("x = \n")
print(x)

# plot
png('test0-plot.png')
plot(x)
dev.off()

# xの範囲を00:00:00から00:05:00に拡大
lim = as.POSIXct(c("2017-04-28 00:00:00", "2017-04-28 00:05:00"), tz="Japan")
cat("lim = ", lim, "\n")

png('test0-plot1.png')
plot(x, xlim=lim)
dev.off()

実行結果
$ Rscript test0.R
r = 19.13138 28.15198 7.95869 5.508244 5.016306 26.64211 3.880155 0.1472298 0.8519172 13.92242
t = 19.13138 47.28335 55.24204 60.75029 65.76659 92.4087 96.28885 96.43608 97.288 111.2104
v = 1.670187 0.5241287 0.1358097 0.4557246 0.2969836 -1.170975 -0.09803701 1.608483 -1.257771 0.7104526
POSIXct(2017-04-28 00:00:00, tz=Japan) = 1493305200
t = 1493305219 1493305247 1493305255 1493305261 1493305266 1493305292 1493305296 1493305296 1493305297 1493305311
x =
2017-04-27 15:00:19 GMT 1.67
2017-04-27 15:00:47 GMT 0.5241
2017-04-27 15:00:55 GMT 0.1358
2017-04-27 15:01:00 GMT 0.4557
2017-04-27 15:01:05 GMT 0.297
2017-04-27 15:01:32 GMT -1.171
2017-04-27 15:01:36 GMT -0.09804
2017-04-27 15:01:36 GMT 1.608
2017-04-27 15:01:37 GMT -1.258
2017-04-27 15:01:51 GMT 0.7105
null device
  1
lim = 1493305200 1493305500
null device
  1
test0-plot.png


test0-plot1.png

CSVファイルの読み書き
# tseriesパッケージを読み込む
library(tseries)

# 要素数
n <- 10

# rexp(n, rate): 指数分布に従うランダム数を生成する
# n: 生成する乱数の数
# rate: 比率のベクトル
r <- rexp(n, rate = 0.1)
cat("r = ", r, "\n")

# cumsum(): ベクトルの累積和
t <- cumsum(r)
cat("t = ", t, "\n")

# rnorm(n): 正規分布に従う乱数をn個生成する
v <- rnorm(n)
cat("v = ", v, "\n")

# ベクトルtの各要素にPOSIXct("2017-04-28 00:00:00", tz="JST")を加える
cat("POSIXct(2017-04-28 00:00:00, tz=Japan) = ", as.POSIXct("2017-04-28 00:00:00", tz="Japan"), "\n")
t <- t + as.POSIXct("2017-04-28 00:00:00", tz="Japan")
cat("t = ", t, "\n")

# irts(time, value): Irregular time-series objectを生成する
# time: 時間のベクトル, POSIXctクラスも使える
# value: 値のベクトル
x <- irts(t, v)
cat("x = \n")
print(x)

# データを書き出す
write.irts(x, file='test1.csv', sep=',')

# 書き出したcsvデータを読み込む
x1 <- read.table(file='test1.csv', sep=',', header=F, col.names=c("datetime", "value"))
x1$datetime <- as.POSIXct(x1$datetime, tz="GMT") # 文字列をPOSIXct形式に変換
print(x1$datetime)
print(x1$value)

x1 <- irts(x1$datetime, x1$value)
cat("x1 = \n")
print(x1)

# plotする
lim = as.POSIXct(c("2017-04-28 00:00:00", "2017-04-28 00:05:00"), tz="Japan")
cat("lim = ", lim, "\n")

png('test1-plot.png')
plot(x1, xlim=lim)
dev.off()
実行結果
$ Rscript test1.R
r = 0.7161429 1.793284 0.2478615 2.984724 12.45114 0.01925959 3.400675 7.554745 1.237016 0.7123535
t = 0.7161429 2.509427 2.757288 5.742012 18.19315 18.21241 21.61309 29.16783 30.40485 31.1172
v = 0.6099315 0.8728334 0.4375745 0.07694671 -0.0349662 -0.9421087 -0.1829869 -1.074823 0.8262679 2.159355
POSIXct(2017-04-28 00:00:00, tz=Japan) = 1493305200
t = 1493305201 1493305203 1493305203 1493305206 1493305218 1493305218 1493305222 1493305229 1493305230 1493305231
x =
2017-04-27 15:00:00 GMT 0.6099
2017-04-27 15:00:02 GMT 0.8728
2017-04-27 15:00:02 GMT 0.4376
2017-04-27 15:00:05 GMT 0.07695
2017-04-27 15:00:18 GMT -0.03497
2017-04-27 15:00:18 GMT -0.9421
2017-04-27 15:00:21 GMT -0.183
2017-04-27 15:00:29 GMT -1.075
2017-04-27 15:00:30 GMT 0.8263
2017-04-27 15:00:31 GMT 2.159
 [1] "2017-04-27 15:00:00 GMT" "2017-04-27 15:00:02 GMT"
 [3] "2017-04-27 15:00:02 GMT" "2017-04-27 15:00:05 GMT"
 [5] "2017-04-27 15:00:18 GMT" "2017-04-27 15:00:18 GMT"
 [7] "2017-04-27 15:00:21 GMT" "2017-04-27 15:00:29 GMT"
 [9] "2017-04-27 15:00:30 GMT" "2017-04-27 15:00:31 GMT"
 [1] 0.60990 0.87280 0.43760 0.07695 -0.03497 -0.94210 -0.18300 -1.07500
 [9] 0.82630 2.15900
x1 =
2017-04-27 15:00:00 GMT 0.6099
2017-04-27 15:00:02 GMT 0.8728
2017-04-27 15:00:02 GMT 0.4376
2017-04-27 15:00:05 GMT 0.07695
2017-04-27 15:00:18 GMT -0.03497
2017-04-27 15:00:18 GMT -0.9421
2017-04-27 15:00:21 GMT -0.183
2017-04-27 15:00:29 GMT -1.075
2017-04-27 15:00:30 GMT 0.8263
2017-04-27 15:00:31 GMT 2.159
lim = 1493305200 1493305500
null device
  1
test1-plot.png

2017年4月28日金曜日

[R]PostgreSQLからのデータ取得

インストール
DBIパッケージとPostgreSQLパッケージをインストールする。

$ R
> options(CRAN="https://cran.ism.ac.jp/")
> options(repos="https://cran.ism.ac.jp/")
> install.packages("DBI")
> install.packages("RPostgreSQL")
DBに接続、データ取得
require("DBI")
require("RPostgreSQL")

connection <- dbConnect(PostgreSQL(), host="localhost, port=5432, dbname="test", user="username", password="password")
sql <- "SELECT * FROM test_table WHERE datetime BETWEEN '2017-03-19 00:00:00' AND '2017-03-19 01:00:00' AND ORDER BY datetime ASC;"
dataset <- dbGetQuery(connection, sql)
print(dataset)

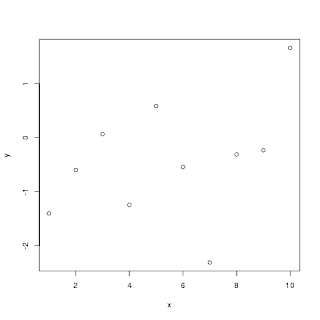
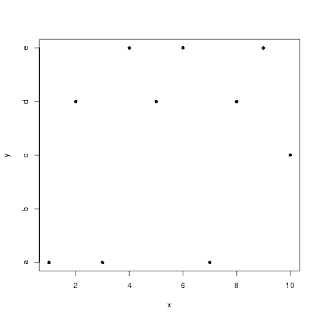
[R]plot

# 数値ベクトル同士のplot
x <- c(1:10) # 1から10までの整数ベクトルを生成する
y <- rnorm(10) # rnorm(n): 正規分布に従う乱数をn個生成する
cat("x = ", x, "\n")
cat("y = ", y, "\n")

# x, yのplot
png('test0-plot.png')
plot(x, y)
dev.off()

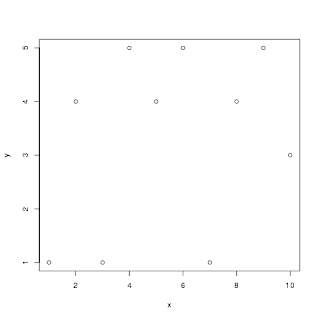
# y=整数のplot
y <- runif(10, min = 1, max=6) # runif(n, min, max): minからmaxの範囲でn個の乱数を生成する
y <- as.integer(y) # 小数点以下を切り捨て
cat("x = ", x, "\n")
cat("y = ", y, "\n")

png('test0-plot1.png')
plot(x, y)
dev.off()

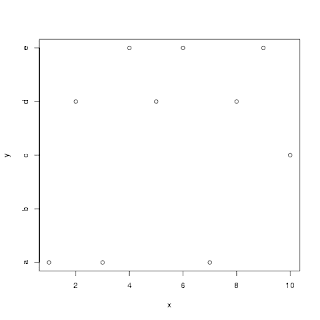
# Y軸の項目を置き換える
png('test0-plot2.png')
plot(x, y, axes=F)
ylabels = c("a", "b", "c", "d", "e")
axis(2, 1:length(ylabels), labels=ylabels)
axis(1, labels=T)
box()
dev.off()

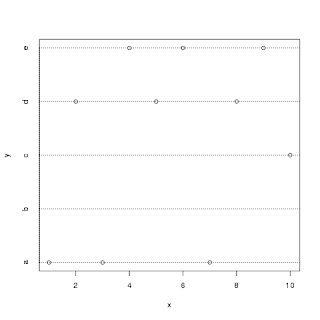
# 参照線を引く
png('test0-plot3.png')
plot(x, y, axes=F)
axis(2, 1:length(ylabels), labels=ylabels, tck=1.0, lty="dotted")
axis(1, labels=T)
box()
dev.off()

# プロットのマーカーを変更する(pch=16は黒丸)
png('test0-plot4.png')
plot(x, y, axes=F, pch=16)
axis(2, 1:length(ylabels), labels=ylabels)
axis(1, labels=T)
box()
dev.off()
実行結果
$ Rscript test0.R
x = 1 2 3 4 5 6 7 8 9 10
y = -1.404267 -0.5969088 0.06568647 -1.244883 0.5858204 -0.5415655 -2.311732 -0.3103803 -0.2324204 1.663108
null device
  1
x = 1 2 3 4 5 6 7 8 9 10
y = 1 4 1 5 4 5 1 4 5 3
null device
  1
null device
  1
null device
  1
null device
  1
test0-plot.png


test0-plot1.png


test0-plot2.png


test0-plot3.png


test0-plot4.png

2017年3月26日日曜日

[Emacs][Elisp]Hook

hook で定義されたアクションが実行される時に紐付けされた hook funcsion が実行される。例えば suspend-hook は Emacs が suspend される直前に実行される hook となる。
add-hook
add-hook 関数を使うことで定義済み hook 変数に関数を追加できる
(add-hook 'text-mode-hook 'turn-on-auto-fill)
text-mode の場合は disable truncate にする
(add-hook 'text-mode-hook
 (lambda() (setq truncate-lines nil)))

[Emacs][Elisp]HTTP 通信

scratch バッファで Elisp による HTTP 通信をしてみた
各命令の最後で Ctrl + j により実行
; TCP コネクション (localhost:80) をはる
; open-network-stream は返値に process 名を返してくるので、それを proc に格納する
(setq proc (open-network-stream "http-proc" "*test-http-buffer*" "localhost" 80))
#
; proc の状態を確認
(process-status proc)
open
; proc に対して送る coding を指定する
(set-process-coding-system proc 'binary 'binary)
nil
; proc に文字列を送る
(process-send-string
proc
(format(concat
"GET / HTTP/1.0\r\n"
"\r\n")))
nil
指定した *test-http-buffer* に結果が表示される
Process http-proc connection broken by remote peer
HTTP/1.1 200 OK
Date: Thu, 06 Aug 2009 13:59:44 GMT
Server: Apache/2.2.9 (Win32) DAV/2 mod_ssl/2.2.9 OpenSSL/0.9.8i mod_autoindex_color mod_python/3.3.1 Python/2.5.2 PHP/5.2.6
Last-Modified: Fri, 06 Mar 2009 23:42:57 GMT
ETag: "6000000000669-1bc-4647bd829e8db"
Accept-Ranges: bytes
Content-Length: 444
Connection: close
Content-Type: text/html
<html>
<head>
<META HTTP-EQUIV="Content-Type" CONTENT="text/html; CHARSET=utf-8">
<title>Test page</title>
</head>
<body>
Hello, world
</body>
</html>
Process http-proc connection broken by remote peer

open-network-stream
open-network-stream NAME BUFFER-OR-NAME HOST SERVICE
TCP 接続を確立する
Table: open-network-stream の引数
引数内容
NAMEprocess 名を指定する
BUFFER-OR-NAMEこの TCP コネクションに割り付けられるバッファ名
HOST接続先ホスト
SERVICEネットワークサービス名 または ポート番号
process-status
process-status PROCESS-NAME
PROCESS-NAME で指定したプロセスの状態を返す
Table: process-status の引数
引数内容
PROCESS-NAMEプロセス名
Table: process-status の返値
返値意味
runプロセスは running 状態
stopプロセスは停止している、再開可能
exitプロセスは終了している
signalプロセスは fatal signal を受けた
openネットワークコネクションが open している
closedネットワークコネクションは close した
connectnon-blocking コネクション、完了待ち
failednon-blocking コネクション、失敗
listenネットワークサーバが listen 中
nil指定したプロセス名のプロセスは存在しない
set-process-coding-system
set-process-coding-system PROCESS &optional DECODING-SYSTEM ENCODING-SYSTEM
PROCESS で指定したプロセスとの output/input 用コーディングを指定する
Table: set-process-coding-system の引数
引数 内容
PROCESSプロセス名
DECODING-SYSTEMプロセスからの output コーディング
ENCODING-SYSTEMプロセスへの input コーディング
process-send-string
process-send-string PROCESS STRING
プロセスに対して文字列を送る
Table: process-send-string の引数
引数 内容
PROCESSプロセス名
STRING文字列

[Emacs][Elisp]プロセス

プロセス実行
start-process

プロセスの状態を監視
フォーマット
set-process-sentinel process sentinel
process が Finished, exited abnormally など特定のイベント状態になった場合に sentinel で渡した命令を実行する
(defun ls-test ()
  (interactive)
  (defun msg-me (process event)
  (princ
    (format "Process: %s had the event [%s]" process event)))
    (set-process-sentinel
    (start-process "ls" "*ls*" "ls" "-a")
    'msg-me)
  )

(defun ls-test2 ()
  (interactive)
  (set-process-sentinel
    (start-process "ls" "*ls*" "ls" "-a")
    (lambda (process event)
    (princ
      (format "Process: %s had the event [%s]" process event)))
    )
  )

*ls*
.
..
COPYING
addpm.exe
cmdproxy.exe
ctags.exe
ddeclient.exe
digest-doc.exe
ebrowse.exe
emacs.exe
emacsclient.exe
emacsclientw.exe
etags.exe
hexl.exe
movemail.exe
runemacs.exe
sorted-doc.exe
*Messages*
Process: ls<1> had the event [finished
]

[Emacs][Elisp]region 指定

(defun dosomething-region (pmin pmax)
  (interactive "r")
  (message "pmin:%d pmax:%d" pmin pmax)
)
region を選択して M-x dosomething-region を実行すると *Messages* バッファに以下のように表示される
pmin:405 pmax:423
interactive に "r" を渡すと選択した region の開始位置、終了位置が引数に格納される。

[Emacs][Elisp]HTTP Post の elisp を interactive 対応

POST 先のサーバ、渡すパラメータ (First name, Last name) を入力することができるようになる
(defun http-post (server fname lname)
  (interactive "sServer:\nsFirst name:\nsLast name:")
  (setq proc (open-network-stream "http-proc" "*http-buffer*" server 80))
  (set-process-coding-system proc 'binary 'binary)
  (setq content-len
    (+ (+ (+ (length "fname=") (length fname)) (length "&lname=")) (length lname)))
  (process-send-string
    proc
    (format (concat
    "POST /test.php HTTP/1.0\r\n"
    "Content-Type: application/x-www-form-urlencoded\r\n"
    "Content-Length: "
    (number-to-string content-len)
    "\r\n"
    "\r\n"
    "fname="
    fname
    "&lname="
    lname))))

[Emacs][Elisp]入力された文字列の長さを表示する

length 関数を使用して入力された文字列を表示する関数
(defun string-length (str)
  (interactive "sInput a string:")
  (setq len (length str))
  (message "String: %s (%d)" str len))
M-x string-length を実行すると mini-buffer に文字列の入力を求めるメッセージが表示される。文字列を入力すると入力した文字列とその文字数を表示する
String: hello (5)

[Emacs][Elisp]interactive 関数

コマンド実行時に質問してきてくれる interactive な関数の定義
(interactive "sWhat is your name: ")
これを実行すると mini-buffer に What is your name: と表示される。そこで文字列を入力すると結果が表示される
(interactive "sWhat your name: ")
("hoge")
数字を入力させる場合は下記のように n を先頭につける
(interactive "nInput your favorite number: ")
(5)
関数を定義して M-x 関数名 で実行すると mini-buffer に interactive で値を入力して渡すことができる
(defun add (a b)
  (interactive "nFirst argument:\nnSecond argument:")
  (setq ans (+ a b))
  (message "Ans: %d" ans))

add
M-x add を実行すると First argument:, Second argument: と mini-buffer に表示され、数値を入力する。計算結果は mini-buffer に出力される

[Emacs][Elisp]関数定義

defun を使って関数を定義する
(defun hello (a b)
  (setq ans (+ a b))
  (message "Ans: %d" ans))

hello
(hello 1 3)
"Ans: 4"
フォーマット
defun NAME ARGUMENT-LIST BODY-FORMS
Table: defun の引数
引数意味
NAME関数名
ARGUMENT-LIST引数リスト
BODY-FORMS関数の中身

HTTP Post する elisp を関数で定義すると下記のようになる
(defun http-post (server)
  (setq proc (open-network-stream "http-proc" "*http-buffer*" server 80))
  (set-process-coding-system proc 'binary 'binary)
  (process-send-string
    proc
    (format (concat
      "POST /test.php HTTP/1.0\r\n"
      "Content-Type: application/x-www-form-urlencoded\r\n"
      "Content-Length: 23\r\n"
      "\r\n"
      "fname=hello&lname=world"))))

http-post
(http-post "localhost")
nil

[Emacs][Elisp]文字列出力

message
message 関数を使用して *Message* バッファに出力する
(message "Hello, world")
*Message* バッファには次のように出力される
Hello, world

princ
文字列出力
*scratch* バッファでテスト
(princ "hello, world")
hello, world"hello, world"

[Emacs][Elisp]バイトコンパイル

M-x byte-compile-file で el ファイルを指定すると elc ファイルを生成してくれる

[Emacs][Elisp]基礎

演算
演算, 評価, evaluation と表現する時もある
(operand arg1 arg2)
例)
(+ 1 2) は 1 + 2 を表す

代入
(variable value)
例)
(auto-fill-mode 1) は auto-fill-mode という変数に 1 を代入する
Auto fill mode: 最大幅までで文字が到達したら自動的に改行を入れる

Labmda
フォーマット
(lambda (arg-variables...)
 [documentation-string]
 [interactive-declaration]
 body-forms ...)
  • 先頭は lambda シンボルを使用する
  • labmda により以下のリストが関数であることを表している。これにより他のリストとはっきり区別をつけている。
  • documentation-string は function 定義を記述する
  • interactive-declaration は interactive code-string を記述する。すなわち M-x で使用する時のコマンド名になる
  • body-form には Lisp コードを記載する
例)
((lambda (a b c) (+ a b c))
 1 2 3)
6
(a b c) という新しい関数を登録する。内容は (+ a b c) となる。その (a b c) という関数に (1 2 3) という引数を渡した結果は 1 + 2 + 3 となるので結果は 6 となる。

2017年3月17日金曜日

[PostgreSQL]データの挿入・参照

テストデータ

テーブル名: students
idname
1Albert
3Emily
14John
テーブル名: dates
iddate
12010-02-25
22010-07-20
32012-12-15
テーブル名: test_scores
idstudent_iddate_idmathphysicschemistry
111694274
231809385
3141354238
412725368
532758587
6142465446
713635465
833858892
9143435341

テーブル作成

testdb=# CREATE TABLE test_scores (id SERIAL PRIMARY KEY, student_id INTEGER NOT NULL, date_id INTEGER NOT NULL, math INTEGER, physics INTEGER, chemistry INTEGER);
testdb=# CREATE TABLE students (id SERIAL PRIMARY KEY, name TEXT);
testdb=# CREATE TABLE dates (id SERIAL PRIMARY KEY, date DATE);

データ挿入

studentsテーブルに登録。
testdb=# INSERT INTO students (id, name) VALUES (1, 'Albert');
INSERT 0 1
testdb=# INSERT INTO students (id, name) VALUES (3, 'Emily');
INSERT 0 1
testdb=# INSERT INTO students (id, name) VALUES (14, 'John');
datesテーブルに登録。
testdb=# INSERT INTO dates (date) VALUES (date('2010-02-25'));
INSERT 0 1
testdb=# INSERT INTO dates (date) VALUES (date('2010-07-20'));
INSERT 0 1
testdb=# INSERT INTO dates (date) VALUES (date('2012-12-15'));
INSERT 0 1
test_scoreテーブルに登録。
testdb=# INSERT INTO test_scores (student_id, date_id, math, physics, chemistry) VALUES (1, 1, 69, 42, 74);
INSERT 0 1
testdb=# INSERT INTO test_scores (student_id, date_id, math, physics, chemistry) VALUES (3, 1, 80, 93, 85);
INSERT 0 1
testdb=# INSERT INTO test_scores (student_id, date_id, math, physics, chemistry) VALUES (14, 1, 35, 42, 38);
INSERT 0 1
testdb=# INSERT INTO test_scores (student_id, date_id, math, physics, chemistry) VALUES (1, 2, 72, 53, 68);
INSERT 0 1
testdb=# INSERT INTO test_scores (student_id, date_id, math, physics, chemistry) VALUES (3, 2, 75, 85, 87);
INSERT 0 1
testdb=# INSERT INTO test_scores (student_id, date_id, math, physics, chemistry) VALUES (14, 2, 46, 54, 46);
INSERT 0 1
testdb=# INSERT INTO test_scores (student_id, date_id, math, physics, chemistry) VALUES (1, 3, 63, 54, 65);
INSERT 0 1
testdb=# INSERT INTO test_scores (student_id, date_id, math, physics, chemistry) VALUES (3, 3, 85, 88, 92);
INSERT 0 1
testdb=# INSERT INTO test_scores (student_id, date_id, math, physics, chemistry) VALUES (14, 3, 43, 53, 41);

参照

結合したテーブルを表示する。
testdb=# SELECT * FROM test_scores JOIN students ON test_scores.student_id = students.id JOIN dates ON test_scores.date_id = dates.id;
 id | student_id | date_id | math | physics | chemistry | id | name | id | date
----+------------+---------+------+---------+-----------+----+--------+----+---- --------
  1 | 1 | 1 | 69 | 42 | 74 | 1 | Albert | 1 | 2010-02-25
  2 | 3 | 1 | 80 | 93 | 85 | 3 | Emily | 1 | 2010-02-25
  3 | 14 | 1 | 35 | 42 | 38 | 14 | John | 1 | 2010-02-25
  4 | 1 | 2 | 72 | 53 | 68 | 1 | Albert | 2 | 2010-07-20
  5 | 3 | 2 | 75 | 85 | 87 | 3 | Emily | 2 | 2010-07-20
  6 | 14 | 2 | 46 | 54 | 46 | 14 | John | 2 | 2010-07-20
  7 | 1 | 3 | 63 | 54 | 65 | 1 | Albert | 3 | 2012-12-15
  8 | 3 | 3 | 85 | 88 | 92 | 3 | Emily | 3 | 2012-12-15
  9 | 14 | 3 | 43 | 53 | 41 | 14 | John | 3 | 2012-12-15
(9 行)
testdb=# SELECT test_scores.id, students.name, dates.date, test_scores.math, test_scores.physics, test_scores.chemistry FROM test_scores JOIN students ON test_scores.student_id = students.id JOIN dates ON test_scores.date_id = dates.id;
 id | name | date | math | physics | chemistry
----+--------+------------+------+---------+-----------
  1 | Albert | 2010-02-25 | 69 | 42 | 74
  2 | Emily | 2010-02-25 | 80 | 93 | 85
  3 | John | 2010-02-25 | 35 | 42 | 38
  4 | Albert | 2010-07-20 | 72 | 53 | 68
  5 | Emily | 2010-07-20 | 75 | 85 | 87
  6 | John | 2010-07-20 | 46 | 54 | 46
  7 | Albert | 2012-12-15 | 63 | 54 | 65
  8 | Emily | 2012-12-15 | 85 | 88 | 92
  9 | John | 2012-12-15 | 43 | 53 | 41
(9 行)

[PostgreSQL]基本操作

Database 作成

createuserコマンドで作成したユーザーで実行
$ createdb testdb (作成するデータベース名)
CREATE DATABASE

Databaseを使う

$ psql testdb
testdb=>

Database一覧表示

postgresユーザーで実行
$ psql
postgres=# \l
  List of databases
  Name | Owner | Encoding | Collate | Ctype | Access privileges
-----------+----------+----------+-------------+-------------+-----------------------
 postgres | postgres | UTF8 | en_US.UTF-8 | en_US.UTF-8 |
 template0 | postgres | UTF8 | en_US.UTF-8 | en_US.UTF-8 | =c/postgres +
  | | | | | postgres=CTc/postgres
 template1 | postgres | UTF8 | en_US.UTF-8 | en_US.UTF-8 | =c/postgres +
  | | | | | postgres=CTc/postgres
(3 rows)

Database削除

postgres=# drop database db_name;
DROP DATABASE

テーブルの作成

testdb=> CREATE TABLE tbl (id SERIAL PRIMARY KEY, date DATE NOT NULL, name TEXT NOT NULL, math INTEGER, physics INTEGER, chemistry INTEGER);

レコードの登録

testdb=> INSERT INTO tbl (date, name, math, physics, chemistry) VALUES (NULL, date('2010-02-25'), 'Albert', 69, 42, 74);
testdb=> INSERT INTO tbl (date, name, math, physics, chemistry) VALUES (NULL, date('2010-02-25'), 'Emily', 80, 93, 85);
testdb=> INSERT INTO tbl (date, name, math, physics, chemistry) VALUES (NULL, date('2010-02-25'), 'John', 35, 42, 38);

レコード一覧を表示

testdb=> SELECT * FROM tbl;
 id | date | name | math | physics | chemistry
----+------------+--------+------+---------+-----------
  1 | 2010-02-25 | Albert | 69 | 42 | 74
  2 | 2010-02-25 | Emily | 80 | 93 | 85
  3 | 2010-02-25 | John | 35 | 42 | 38
(3 rows)

テーブル定義の確認

testdb=> \d tbl
  Table "public.tbl"
  Column | Type | Modifiers
-----------+---------+--------------------------------------------------
 id | integer | not null default nextval('tbl_id_seq'::regclass)
 date | date | not null
 name | text | not null
 math | integer |
 physics | integer |
 chemistry | integer |
Indexes:
  "tbl_pkey" PRIMARY KEY, btree (id)

psqlコマンド終了

testdb=> \q

postgresqlを再起動

# service postgresql restart

[CentOS][PostgreSQL]インストール

インストール

# yum install postgresql
# yum install postgresql-server

サービスの起動

# service postgresql start
postgresql サービスを開始中:            [  OK  ]

データベースクラスタの作成

# su - postgres
$ echo $PGDATA
/var/lib/pgsql/data
$ initdb --encoding=UTF8 --no-locale

ユーザー作成

  1. postgresユーザーに移行
    $ su -  postgres
    
  2. ユーザー作成
  3. $ createuser
    Enter name of role to add: xxxx
    Shall the new role be a superuser? (y/n) n
    Shall the new role be allowed to create databases? (y/n) y
    Shall the new role be allowed to create more new roles? (y/n) n
    CREATE ROLE
    

一般ユーザーの作成

  1. postgresユーザーに移行
    $ su -  postgres
    
  2. ユーザー作成
  3. $ createuser username
    
  4. ユーザーが作成されていることを確認する
    $ psql
    postgres=# SELECT usename,usesuper from pg_user;
      usename | usesuper
     ----------+----------
      postgres | t
      xxxx | f
    (2 rows)
    
    postgres=# \q
    

phpPgAdminのインストール

  1. phpPgAdminのインストール
    $ sudo yum install phpPgAdmin
    
  2. 設定
    1. postgresユーザーでログインできるように、/etc/phpPgAdmin/config.inc.phpを編集する。
      # vi /etc/phpPgAdmin/config.inc.php
      $conf['extra_login_security'] = false; ← trueをfalseに変更する
      
    2. PostgreSQL, httpdを再起動する。
      # service postgresql restart
      # service httpd restart
      
  3. 動作確認
    http://localhost/phpPgAdmin/にブラウザでアクセスする。