# 出力ファイル名
filename = "test1-"
file_no = 0

# 数値ベクトル同士のplot
x <- c(1:10)   # 1から10までの整数ベクトルを生成する
y <- rnorm(10) # rnorm(n): 正規分布に従う乱数をn個生成する
cat("x = ", x, "\n")
cat("y = ", y, "\n")

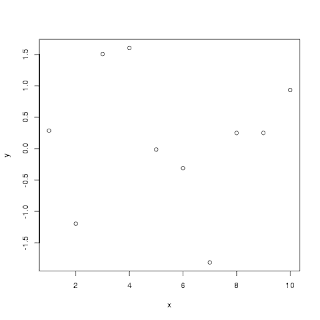
# 基本のplot
output = paste(filename, file_no, ".png", sep="") # 文字列間に空白が入るのでsep=""を指定して空白なしにする
file_no = file_no + 1
cat("output = ", output, "\n")
png(output)
plot(x, y)
dev.off()

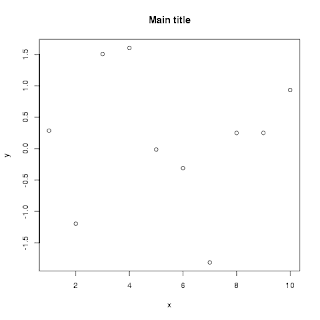
# グラフタイトル
output = paste(filename, file_no, ".png", sep="") # 文字列間に空白が入るのでsep=""を指定して空白なしにする
file_no = file_no + 1
cat("output = ", output, "\n")
png(output)
plot(x, y, main="Main title")
dev.off()

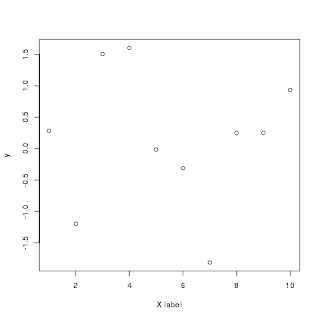
# X軸項目名
output = paste(filename, file_no, ".png", sep="") # 文字列間に空白が入るのでsep=""を指定して空白なしにする
file_no = file_no + 1
cat("output = ", output, "\n")
png(output)
plot(x, y, xlab="X label")
dev.off()

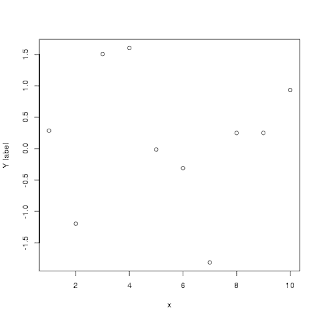
# Y軸項目名
output = paste(filename, file_no, ".png", sep="") # 文字列間に空白が入るのでsep=""を指定して空白なしにする
file_no = file_no + 1
cat("output = ", output, "\n")
png(output)
plot(x, y, ylab="Y label")
dev.off()
実行結果
$ Rscript test1.R
x =  1 2 3 4 5 6 7 8 9 10
y =  0.2868086 -1.195694 1.50674 1.604657 -0.01464439 -0.3106049 -1.813415 0.2500726 0.2512269 0.9339756 output =  test1-0.png null device
          1
output =  test1-1.png
null device
          1
output =  test1-2.png
null device
          1
output =  test1-3.png
null device
          1
test1-0.png

test1-1.png

test1-2.png

test1-3.png

0 件のコメント:
コメントを投稿